
When are Home Prices Going to Come Down?
I got asked this one again just this weekend. A friend pulls me aside — and look, I get this question more than nearly any other — and goes, "James, when are these prices finally going to come down?"
Fair question to ask. Ever since COVID sent home values through the roof, everyone's been waiting on the correction. And who could blame them? Last time prices ran up like this, they fell straight off a cliff. So surely it happens again, right?
Here's the thing, though — we're six years into this run now, and it hasn't. So I figured I'd share with you what I shared with him.
Let's Park the Outliers for a Minute
Now, I'm a fella who sells houses — not an economist, and I'll be the first to tell you that. But here's what I keep coming back to.
Set the outliers aside for a second. This country's gotten so used to the outliers that they're not even rare anymore — and we still can't predict when they'll land or which way they'll shove the market. Nobody saw a global pandemic coming. And almost no one in real estate predicted it'd push the government to pump six trillion dollars into the system. That's $6,000,000,000,000 — go ahead and count the zeros.
I bring that up because that's the real oddity about this last spike in home values.
Why This Cycle Looks Different
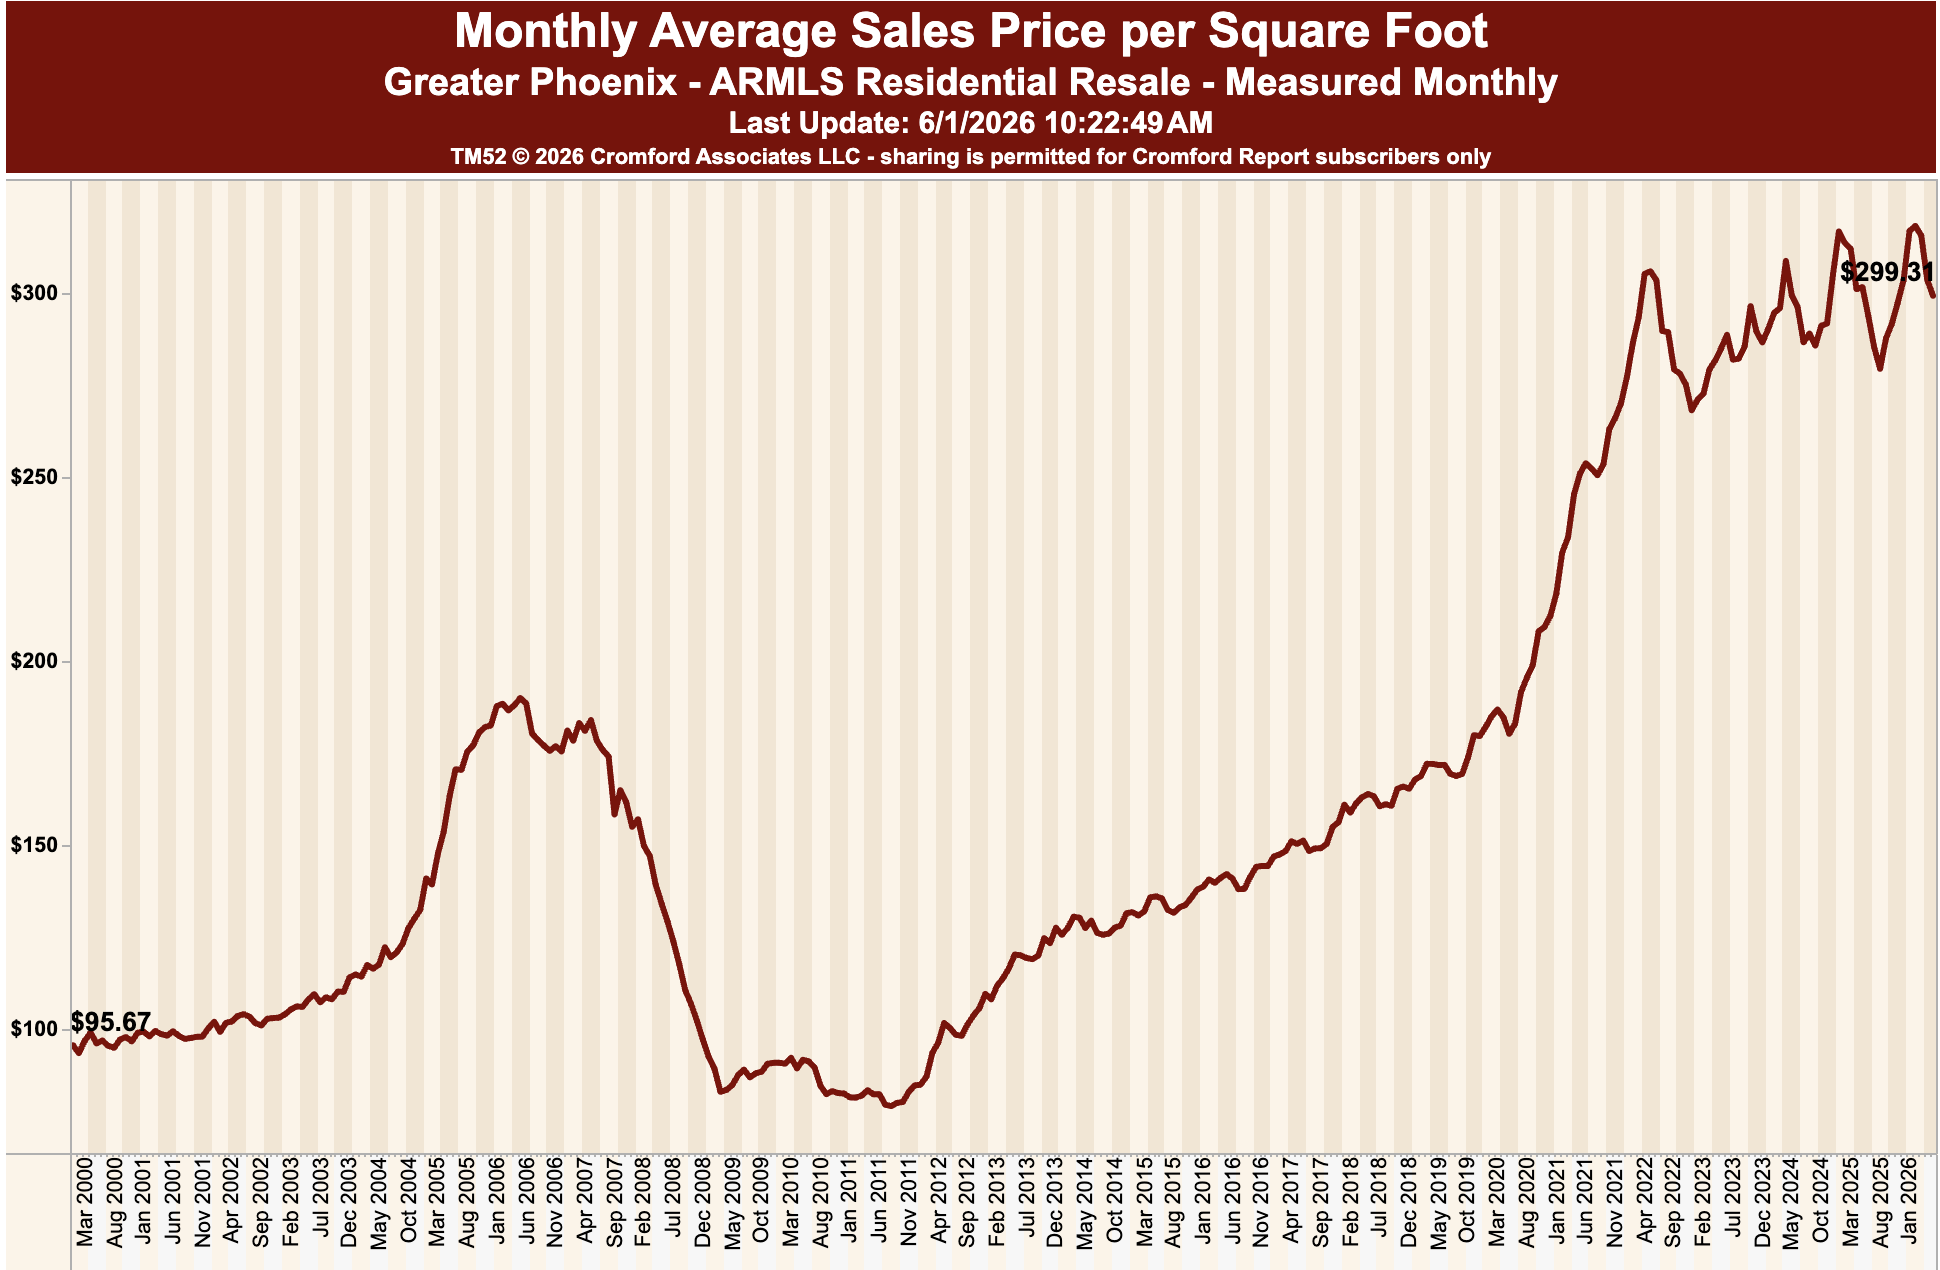
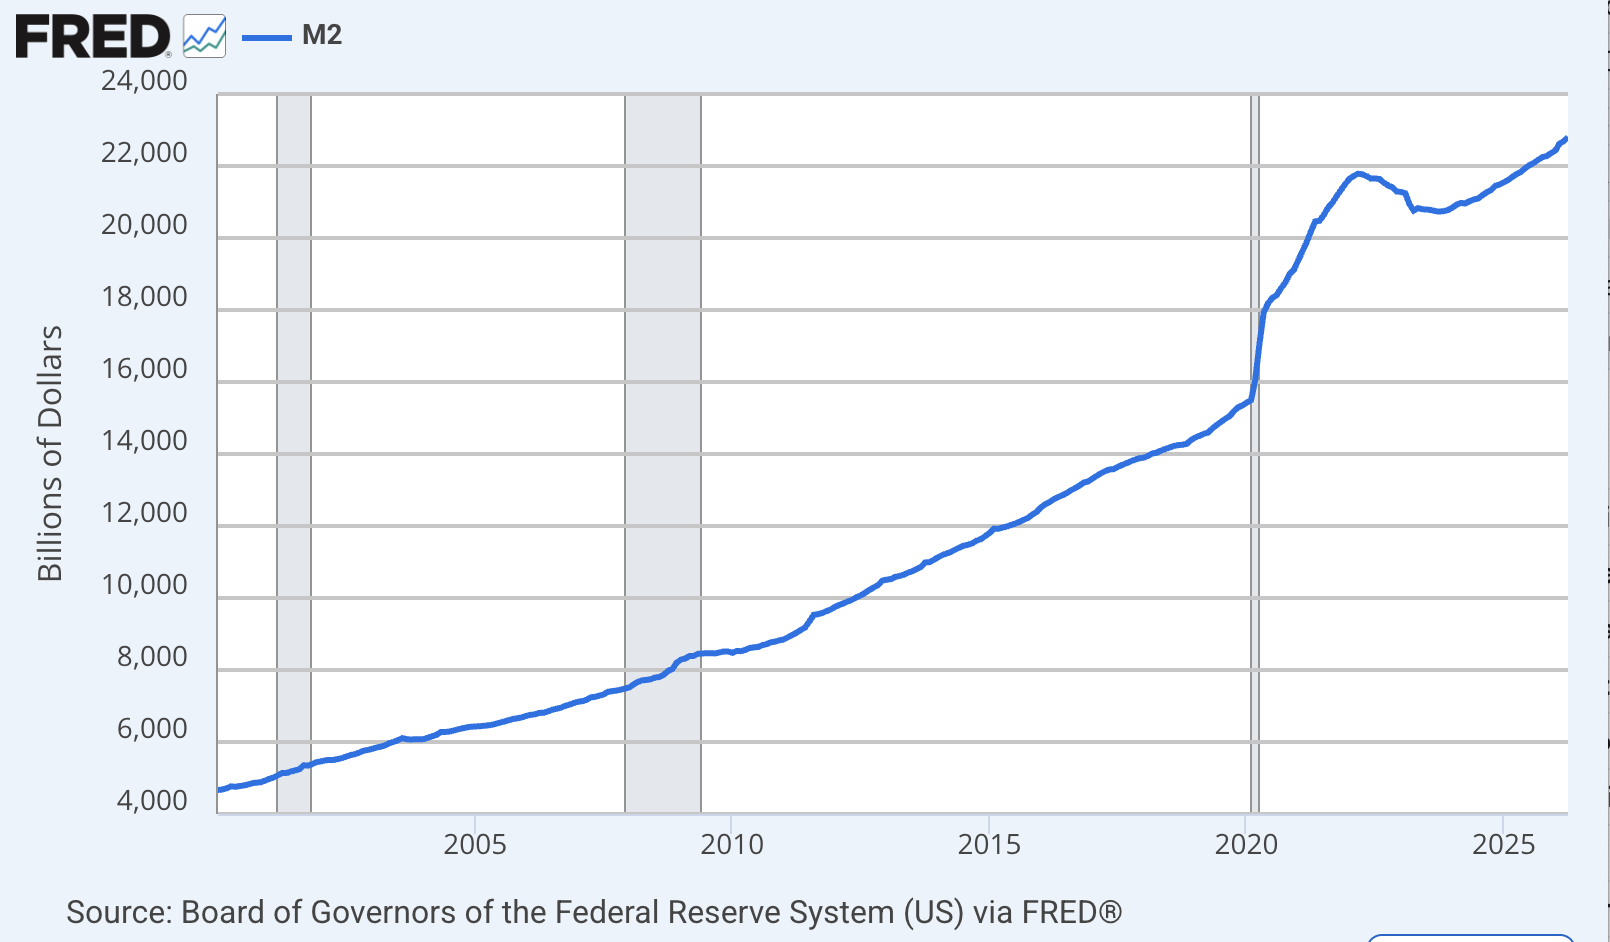
The data geeks out there love their FRED charts, and I'll chance my arm and admit I enjoy poking around the real estate ones myself now and then. They're a bit out of date and usually too broad to be all that useful, but they're a solid, credible record of what's already happened. Today, though, I want to look at a money chart — the M2, specifically.
This one covers the exact same stretch as the home-value chart up top.
Here's what jumps out at me. Back in the 2003-to-2008 run, the money supply barely budged. Home values climbed anyway — that was credit loosening up, and it was never going to hold. The proof was in the pudding, and the pudding fell apart.
But the COVID run-up? That was demand, driven by low, low, low interest rates — and look at the money supply over the same window. It grew almost in lockstep. Both peaked in April of 2022. Both eased off afterward. And both are back on an upward trend. Boom — that's the part most folks skip right over. Makes you wonder whether that's the very reason this run has held for over six years now.
So... When Do They Come Down?
What goes up must come down. I believe in that, I do. Knowing when is the magic. Timing the market is near enough impossible — but I bring the money-supply chart into the conversation because, honestly, I'm curious what you make of it. Is this a fair way to read why values have held up?
What's it going to take to bring that money supply down? My hunch is that whenever it goes, home-value decreases won't be far behind it.
Hold the phone — foreclosures are rising?
That's a story for the next one. More soon.